Quality vs. quantity: don’t be a victim of mass deception
As we’ve explained in many previous articles, a complete break from training now and again is a good thing as it allows the muscles to undergo complete recovery, in a way that is not possible when training is taking place in a regular basis. An excellent example of this fact comes from a 2017 study, where Norwegian researchers looked at the effects of participating in a cross-country skiing stage race (‘Tour de Ski’), in which the participants raced from 4-25kms everyday for a week(1). One of the key findings was that in many of these athletes, subsequent performance was depressed for at least six weeks following the Tour, indicating that full and deep recovery can take a good deal longer than is generally recognised.
The downsides of extended recovery
While an extended recovery following a period of hard training can provide a long-term performance boost, there can be a downside, especially when training is wound up for a few weeks over the Christmas period. That downside is unwanted weight gain. Weight gain can easily arise because energy (and therefore food calorie) demand drops very significantly when training is ceased, but this drop in energy demand happens at the very same time as calorie intake rises - thanks to the abundance of rich and/or sweet foods consumed, along with alcohol as part of the holiday festivities!
Let’s give some perspective here; gaining a couple of pounds over the Christmas holiday period is nothing to worry about as those pounds will inevitably be shed as soon as normal training resumes. Moreover, being able to switch off, relax and spend high-quality time with your loved ones is good – indeed, necessary even - for your mental well being, even if your normal eating patterns do go off the rails a bit! The problem arises when that weight gain becomes more than just an odd pound or two. Putting on several pounds means it not only takes longer to shed when training resumes, but can also be demotivating too – especially for novice athletes just finding their way into a healthier, fitter lifestyle.
Hidden fat gain
Although weighing yourself to track changes in your body mass can be a useful indicator, it’s only half the story. That’s because those scales sitting in millions of bathrooms up and down the country might tell you how much mass your body contains, but give no idea about its composition – ie how much of that mass is composed of lean body tissue, such as muscle and bone and how much is body fat. This really matters because while gains in lean muscle mass are generally conducive to improved sports performance, gains in body fat are not.
Knowing only your weight (body mass) and not its composition presents a problem because it’s a fact that when training is put on hold, some muscle mass loss, especially in strength athletes, is unavoidable(2). It follows therefore that when taking a break from training, you might be comforted to observe no gain in overall mass when you jump on those scales. The reality however is that it’s likely you have lost some lean muscle mass and gained a similar amount of fat mass – ie your body composition has become ‘fatter’! As a rule of thumb then, using body mass to track weight (fat gain) is only meaningful when your week-to-week- training habits (exercise type, volume and intensity) remain unchanged. In all other circumstances, some kind of body composition analysis is much more useful!
Basic fat facts
It’s important not to get paranoid about body fat. Some reserves of body fat are essential for health and when stores dip too low, the risk of illness, infections and injury can increase(3). However, most people in the West carry too much body fat, largely as a result of refined processed diets and sedentary lifestyles(4). Small excesses of body fat are not harmful but will hinder sports performance by reducing power-to-weight ratio. Large excesses are harmful to health, and increase the risk of strokes, high blood pressure, coronary heart disease and some types of cancer(5,6).
The crucial measurement of body fat is ‘body fat percent’, which simply tells you what proportion of your mass is lean mass and what proportion is body fat. A woman with a total mass of 50kgs, comprised of 10kgs of fat tissue and 40kgs of lean tissue has 1/5th or 20% of her mass in the form of fat - ie her body fat measurement is said to be 20%. Table 1 shows the approximate recommended body fat percentages for men and women of different ages. However, for a more detailed breakdown of the categories of body fat % (ie too low, excellent, good, fair, poor, too high) given by age and sex, readers are recommended to download an excellent fact sheet from the University of Pennsylvania Athletics and Recreation Department(7), which can be found here.
Table 1: Approximate healthy body fat percentage ranges for ‘normal population groups’ by age
|
Age |
Male |
Female |
|
1-30 |
12-18% |
20-26% |
|
31-40 |
13-19% |
21-27% |
|
41-50 |
14-20% |
22-28% |
|
51-60 |
16-20% |
22-30% |
|
61+ |
17-21% |
22-31% |
Note: for athletes in hard training, ideal body fat levels may be a good 5% below the minimum levels shown in table 1.
Determining body fat percentage and body composition
There’s only one sure way to discover the exact composition of the body and that’s to cut it open and physically separate all the lean tissue such as organs, muscle and bone from the fatty tissue. Not surprisingly, few of us are willing to die in the cause of accurate body fat measurement so over the years, scientists have come up with some alternative methods of estimating body fat %. These range from simple estimation to highly accurate and advanced techniques. Examples include(8):
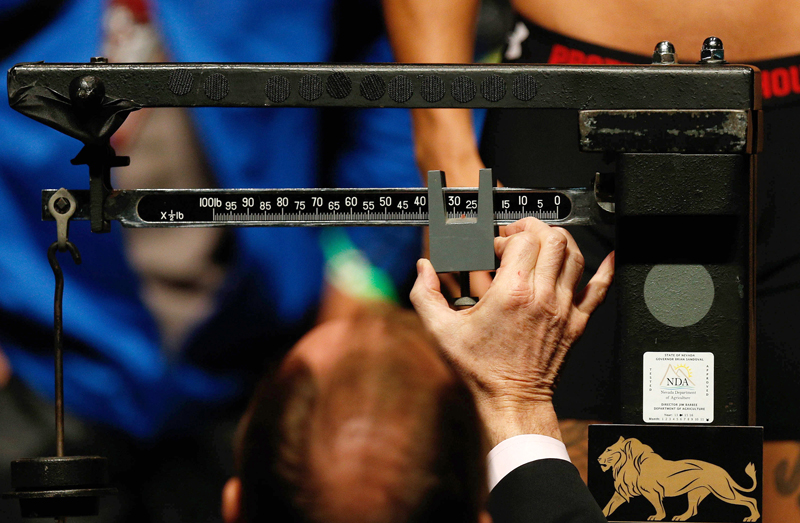
· Scales – measure the total mass (weight) of the body but cannot distinguish between lean and fat mass and cannot detect if weight changes are due to fat, or lean mass. Scales may also be misleading because of natural variations in hydration levels (eg younger women at certain times of the month) and when exercise habits change (exercise increases lean body mass – a good thing).
· Body Mass Index (BMI) – relates weight to height (BMI = weight in kilos divided by height in metres squared). BMIs of 20-25 are considered healthy – 26 and over are considered overweight. While better than scales alone and simple/quick to calculate (hence popular with doctors), BMIs are still a poor way of assessing whether someone is carrying too much/little body fat, especially in athletes, well muscle people and those with a large bone structure.
· Skinfold calipers – measure fat stored under the skin at different sites and these figures are then used to predict body fat %. Calipers can yield quite accurate results in the hands of a skilled professional, but the major drawback is that you can’t take your own measurements.
· Body Impedance Analysis (BIA) – measures the resistance in the body to a small flow of electric current. Using sophisticated algorithms, water content, lean body mass and hence body fat % can be calculated quite accurately. BIA is generally easy to self-administer, but for accurate results, subjects must be properly and consistently hydrated, especially when trying to track changes over time.
· Near Infra-Red (NIR) – detects the ‘chemical signature’ of fat molecules in the body using infra-red beams and uses this information to calculate body fat %. Although generally dearer than BIA, NIR is easy to use, free from hydration problems and is quite accurate.
· Hydrostatic underwater weighing (densiometry) – compares bodyweight measured on dry land with that measured underwater. Since the density of lean tissue is very close to water but that of body fat is significantly lower, the lower the measured weight in water compared to land, the higher the % of body fat. Densiometry is highly accurate but requires a dedicated facility in a pool and trained technicians – hence it is only really used in a research setting.
· Medical Techniques – include very accurate but more exotic and expensive methods, the gold standard being Dual Energy X-ray Absorptiometry (DXA), which is often used to validate other methods Total Body Potassium (TBK) and Neutron Activation Analysis can also be used but unless you’ve a spare $million or two knocking around for the equipment and technicians, you’re best sticking to the simpler techniques above!
You need to be logged in to continue reading.
Please register for limited access or take a 30-day risk-free trial of Sports Performance Bulletin to experience the full benefits of a subscription. TAKE A RISK-FREE TRIAL
Newsletter Sign Up
Testimonials
Dr. Alexandra Fandetti-Robin, Back & Body Chiropractic
Elspeth Cowell MSCh DpodM SRCh HCPC reg
William Hunter, Nuffield Health
Newsletter Sign Up
Coaches Testimonials
Dr. Alexandra Fandetti-Robin, Back & Body Chiropractic
Elspeth Cowell MSCh DpodM SRCh HCPC reg
William Hunter, Nuffield Health
Keep up with latest sports science research and apply it to maximize performance
Today you have the chance to join a group of athletes, and sports coaches/trainers who all have something special in common...
They use the latest research to improve performance for themselves and their clients - both athletes and sports teams - with help from global specialists in the fields of sports science, sports medicine and sports psychology.
They do this by reading Sports Performance Bulletin, an easy-to-digest but serious-minded journal dedicated to high performance sports. SPB offers a wealth of information and insight into the latest research, in an easily-accessible and understood format, along with a wealth of practical recommendations.
*includes 3 coaching manuals
Get Inspired
All the latest techniques and approaches
Sports Performance Bulletin helps dedicated endurance athletes improve their performance. Sense-checking the latest sports science research, and sourcing evidence and case studies to support findings, Sports Performance Bulletin turns proven insights into easily digestible practical advice. Supporting athletes, coaches and professionals who wish to ensure their guidance and programmes are kept right up to date and based on credible science.

