The glycaemic index: make it work for you
Glucose is your body’s premium grade fuel and almost all of it is derived from dietary carbohydrate. But, although all carbohydrates supply glucose to the body, the rate at which they are digested and release that glucose into the bloodstream, where it can be absorbed, varies considerably.
For example, the carbohydrate in oatmeal consists of glucose building blocks chemically bound together in long chains to form starch; and the glucose can’t be released into the bloodstream until digestion breaks the chemical bonds in the starch chains to release the individual glucose building blocks, all of which takes time. This process is also slowed down considerably by the presence of gummy fibres, which tend to trap the starch in a gel-like matrix, further delaying the release of glucose. The net result is that the release of glucose into the blood following an oat-based meal is slow, gentle and prolonged.
Now contrast this with the same amount of carbohydrate consumed in the form of a drink sweetened with glucose syrup. Most of the carbohydrate in glucose syrup comes from free, unbound glucose building blocks, so it can pass straight from the intestine into the bloodstream, without digestion, in a rapid sudden surge.
Since glucose is such an important molecule in energy metabolism, it would be surprising if our bodies didn’t have precise mechanisms for controlling its flow around the body, as indeed they do. The brain runs almost exclusively on glucose, which it gets from the blood as the end result of breaking down dietary carbohydrate. However, the brain is extremely sensitive to the concentration of glucose in the blood (often referred to as ‘blood sugar’); even a mild shortfall can produce such symptoms as weakness, dizziness, fatigue, poor concentration and confusion, while large excesses (as you get with uncontrolled diabetes) can lead to coma and even death.
Blood glucose levels are controlled by hormones, which stimulate hunger pangs and the release of glucose from liver stores when blood glucose drops (eg when food hasn’t been eaten for a few hours) and which promote the uptake of glucose into the tissues, such as muscle, when blood glucose levels rise too high (as after a meal containing quick releasing carbohydrates). In healthy adults, between meals the body strives to maintain a blood glucose level of around 3.4-6.0 millimoles per litre (60-110mg of glucose per 100ml). When blood glucose rises above the upper limit (eg after a meal), the hormone insulin stimulates uptake of glucose into the cells, where it can be stored as glycogen in muscles and the liver or transformed to triglycerides (precursors to fat molecules). The net effect is to lower blood glucose.
After several hours without food, blood glucose levels tend to drift downwards, and when the level drops below the lower limit the hormone glucagon stimulates the conversion of liver glycogen back to glucose and, if liver glycogen stores are low, also provides a route for the production of glucose from fragments of other molecules, such as lactate and amino acids. The net effect is a rise in blood glucose. Together, insulin and glucagon keep blood glucose within the narrow range required by the body and, in particular, the brain.
If blood glucose levels are so carefully controlled, why does the rate of glucose release from dietary carbohydrates matter? The reason is that each time your body acts to bring blood glucose back to within its optimum range, a number of physiological consequences follow.
Eat a meal rich in quick releasing carbohydrates, such as sugar, and your blood glucose rockets upwards, causing a rapid release of insulin. This can be good or bad depending on the circumstances. After training, for example, when your muscles are ‘hungry’ for glucose to replenish depleted glycogen stores, a rapid rise in insulin stimulates the uptake of glucose and amino acids into those muscles, so aiding growth and repair.
However, eat that same meal when there’s no particular demand for glucose and, once your liver glycogen stores are topped up, there’s only one possible destiny for the excess glucose removed from the blood by insulin – storage as fat!
Insulin control is not perfect, particularly when the rise in blood sugar from eating dietary carbohydrates is large and rapid, such as after a sugary meal. A rapid rise in blood sugar stimulates a larger-than-normal insulin response with the result that blood sugar levels can eventually end up below the optimum range, leading to both mental and physical fatigue. This explains why some people find that quick releasing carbohydrates give an initial energy boost, giving rise to a subsequent dip 30-60 minutes later.
There is considerable individual variability in insulin response, though, and some people can eat quick releasing carbohydrates with impunity, while others find they play havoc with energy levels!
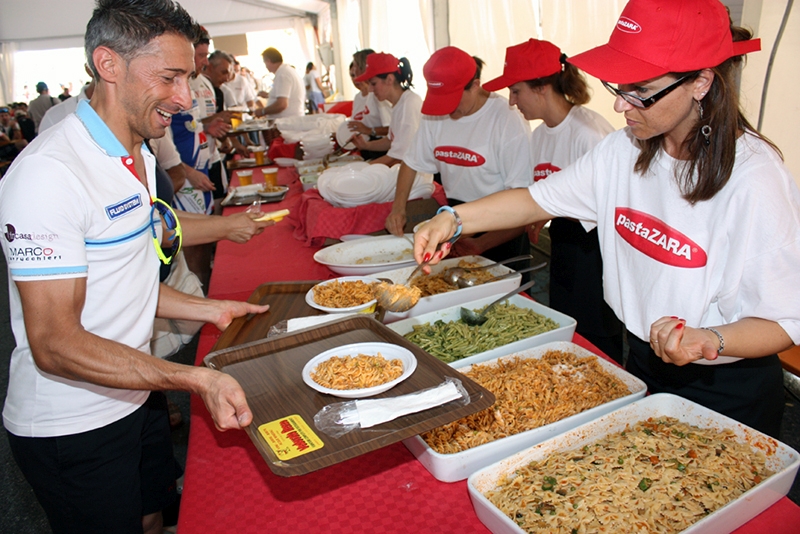
On the other hand, slow releasing carbohydrates, such as oats, pasta, lentils and beans, produce only a gentle rise in blood sugar and a correspondingly small insulin response, making it easier for the body to maintain optimum blood glucose levels.
Another benefit of slow releasing carbohydrates is that, for a given calorie intake, blood glucose levels are sustained in the desired range for longer than when quick release carbohydrates are consumed. This delays the onset of hunger (useful when weight control is a priority) and also reduces the risk that stored proteins will need to be broken down for energy, thus depleting muscle mass!
Because the varying energy release rates of different carbohydrates impact on a range of physiological functions, including sport performance, scientists have devised a way of measuring their effect on blood glucose levels. The result is the ‘glycaemic index’, whereby carbs are ranked on a scale from 0 to 100 according to the extent to which they raise blood sugar levels. Foods with a high GI are those which are rapidly digested and absorbed and result in marked fluctuations in blood sugar levels, while low GI foods are digested and absorbed slowly, producing gradual rises in blood sugar and insulin levels.
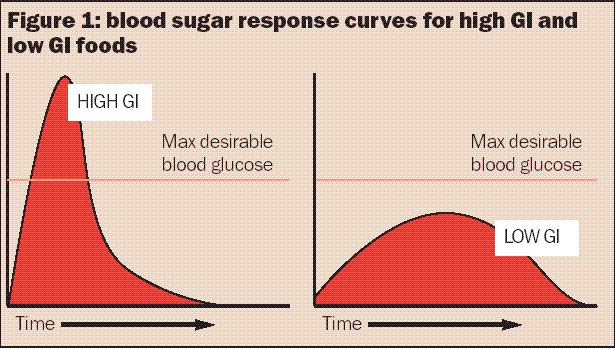
To determine the GI rating of a given carbohydrate, measured portions are fed to healthy people after an overnight fast, with blood samples collected at 15-30 minute intervals over the next two hours. These blood samples are used to construct a blood sugar response curve, as illustrated in figure 1, below, which determines the GI rating in relation to pure glucose. Pure glucose (one of the very quickest releasing carbohydrates) is assigned a value of 100 and all other foods are ranked by comparison.
Figure 1: blood sugar response curves for high GI and low GI foods
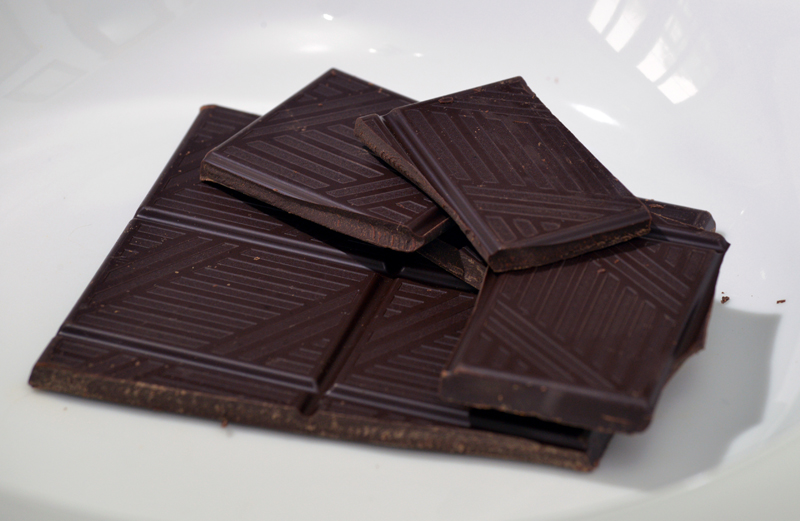
The GI rating table, opposite, contains a few surprises. For example, a baked potato releases glucose into the bloodstream 50% faster than chocolate, which contains plenty of sugar! Similarly, that wholesome Shredded Wheat breakfast cereal causes a faster rise in blood sugar than apricot jam! That is because the GI rating of a carbohydrate is not determined purely by how ‘refined’ or sugary it is but also by the following factors:
- The type of sugar present – Fructose (the main sugar in fruit) has to be converted to glucose in the liver before it can appear in the blood, thereby reducing the rate at which blood glucose rises and attracting a relatively low GI rating. Sucrose (table sugar) consists of one unit of glucose and one of fructose bonded together; this bond has to be broken before free glucose is released and then fructose has to be converted to glucose. This explains why the GI of table sugar is much lower than that of pure glucose;
- Amount and type of fibre present – Fibre delays breakdown of carbohydrate in a number of ways. Sometimes it acts as a physical barrier, slowing down the digestive process of breaking down carbohydrate; this is why whole apples have a lower GI than apple juice. Sometimes, as with porridge, gummy fibres bind the carbohydrate into a gel-like structure, slowing down the rate of digestion;
- Carbohydrate microstructure – The structure of the food can also play a role. For example, with pasta the physical entrapment of starch granules in a sponge- like network of protein molecules in the pasta dough slows digestion, leading to a low GI rating;
- Amount of fat present – Fat in foods tends to slow the rate of stomach emptying and therefore the rate at which foods are digested. For any given carbohydrate, the presence of fat will produce a lower GI, which explains why crisps have a lower GI than boiled or baked potatoes and ice cream a lower GI than sorbet!
The glycaemic load, in units, of a portion of carbohydrate is expressed as: GI rating x grams of carbohydrate in portion size/100. Note that each unit of GL produces the same effect on blood sugar as eating 1g of pure glucose.
The glycaemic load rating makes sense of some of the surprising GI rankings. For example, a banana may have a GI rating of 58 compared with just 49 for chocolate, but comparing GL values paints the true picture. A typical 120g banana contains around 24g of carbohydrate, which has a GI value of 58. The GL is therefore 58 x 24/100, ie approximately 14 units. But 120g of chocolate provides 75g of carbohydrate, which has a GI value of 49, and so has a GL value of 75 x 49/100 = 32 units. In other words, gram for gram, chocolate has more than twice the impact on your blood sugar of bananas, despite its lower GI ranking.
| (Approximate values, varying according to brand/ variety/ripeness/ preparation etc) (2) | |
|---|---|
| Glucose | 100 |
| Rice Crispies | 83 |
| Cornflakes | 81 |
| Puffed Wheat | 80 |
| Jelly beans | 80 |
| Dark rye bread | 76 |
| Doughnut | 76 |
| Potato (boiled or mashed) | 74 |
| Dates (dried) | 72 |
| Swede | 72 |
| Potato (jacket baked) | 72 |
| White bread | 70 |
| Shredded Wheat | 70 |
| Wholemeal bread | 69 |
| Croissant | 69 |
| French baguette | 68 |
| Parsnips | 68 |
| Pineapple | 66 |
| Rye bread | 65 |
| Mars bar | 65 |
| Table sugar | 65 |
| Apricot (tinned) | 64 |
| Raisins | 64 |
| Beetroot | 64 |
| Potato: new | 62 |
| Ice cream | 61 |
| Digestive biscuit | 60 |
| Pitta bread | 58 |
| Muesli | 58 |
| Banana (ripe) | 58 |
| Sourdough | 57 |
| Sultanas | 57 |
| Rich Tea biscuits | 57 |
| Mango | 56 |
| Sweet corn | 55 |
| Apricot (jam) | 55 |
| Popcorn | 55 |
| Orange juice | 55 |
| Special K | 54 |
| Potato crisps | 54 |
| Sweet potato | 54 |
| Kiwi fruit | 53 |
| Carrots | 51 |
| Oat bran | 50 |
| Mixed grain | 49 |
| Chocolate | 49 |
| Peas | 48 |
| Grapes | 48 |
| Baked beans (tinned) | 46 |
| Porridge | 46 |
| Pineapple juice | 46 |
| Fructose | 46 |
| Orange | 44 |
| Apple juice (clear) | 44 |
| All Bran | 43 |
| Spaghetti (white) | 43 |
| Peach | 42 |
| Pinto beans | 40 |
| Spaghetti (wholemeal) | 39 |
| Tomato juice | 38 |
| Apple | 37 |
| Pear | 36 |
| Chickpeas | 33 |
| Hazelnuts | 33 |
| Yoghurt (low-fat, sweetened) | 33 |
| Split peas | 32 |
| Strawberry | 32 |
| Milk (skimmed) | 32 |
| Plums | 32 |
| Butter beans | 31 |
| Apricot (dried) | 30 |
| Banana (unripe) | 30 |
| Peanut butter | 29 |
| Kidney beans | 28 |
| Lentils | 28 |
| Milk (full fat) | 27 |
| Grapefruit | 25 |
| Cherries | 22 |
| Cashews | 22 |
| Peanuts | 22 |
| Soya beans | 20 |
| Yoghurt (low-fat, unsweetened) | 14 |
| Glycaemic index (GI) | Glycaemic load (GL) Individual serving | Glycaemic load Total daily intake | |
| Low | 55 or below | 10 or below | Below 80 |
| Medium | 56-69 | 11-19 | 80-120 |
| High | 70-plus | 20-plus | 120-plus |
Pre-training GI values
Attention then turned to the issue of how different GI carbs affect performance when consumed before training, with Australian researchers noting that a low GI carbohydrate meal (lentils) eaten one hour before exercise increased cyclists’ time to exhaustion by comparison with an equal amount of carbohydrate eaten in the form of a high GI carbohydrate food (potatoes) (3). Their explanation was that the lower glucose and insulin responses produced more stable levels of blood glucose throughout the cycling bout which, combined with a slower rate of muscle glycogen usage, would have enhanced endurance.This study lent credibility to the notion that consuming high GI carbs before training was probably not a good idea because they could impair performance by destabilising blood sugar levels. And it probably explains why endurance athletes are now advised to choose low glycaemic carbohydrate foods for their pre-event or pre-training meals.
The problem is that much of the subsequent research has failed to support these findings. In a follow-up study, the same researchers fed cyclists either low GI or high GI meals one hour before cycling to exhaustion (4). They found that, although the low GI meals were associated with higher blood glucose levels after 90 minutes of exercise than their high GI counterparts, there were no differences in time to exhaustion.
Another study compared the effects of low GI food (lentils) and high GI food (potatoes) in cyclists before 50 minutes of submaximal cycling followed by a 15-minute performance trial (5). As expected, the high GI meal led to an increase in blood glucose before exercise and a decline in blood glucose at the onset of exercise by comparison with the low GI meal. But again this made no difference to performance.
However, not all the subsequent research has been negative. In a similar trial on cyclists, plasma insulin levels were lower for the low GI meal through the first 20 minutes of cycling, and the exercise time to exhaustion was longer (6). The low GI meal also maintained higher blood glucose levels at the end of two hours of exercise.
There’s still some degree of uncertainty about the advantages of low GI carbs over high GI carbs as pre-race snacks/meals. And the fact that some individuals are known to be particularly sensitive to insulin-induced blood sugar falls may account for the somewhat mixed research results.
Some research has also suggested that the GI of pre-exercise carbohydrate may affect the ratio of fat to carbohydrate used as fuel. In a study on runners, fed either low or high GI carbohydrate three hours before a treadmill run, researchers were intrigued to discover that, although performance times did not differ significantly, during the first 80 minutes of exercise, carbohydrate oxidation was 12% lower and fat oxidation 118% higher in the low GI trial than the high GI trial(7)!
This finding is supported by more recent research on runners, who took part in three treadmill runs three hours after being fed either high GI food, low GI food or no food at all (8). As expected, the researchers found that the fasting state produced the highest rate of fat oxidation during exercise. However, total fat oxidation was also significantly higher in the low GI trial than in the high GI trial, while the high GI meal caused a significant drop in blood glucose to below the fasting level – not a desirable effect!
An increased rate of fat oxidation following a low GI meal could be important because it would conserve muscle glycogen, so prolonging endurance in longer events, while maintaining or reducing body fat.
There is also some evidence that low GI pre- exercise meals may help endurance athletes by reducing blood lactate. Another study on trained cyclists involved an incremental exercise test to exhaustion 65 minutes after consuming either high GI, low GI or non-carbohydrate food (9). Although time to fatigue did not differ significantly between the groups, during exercise blood glucose levels were significantly lower in cyclists who’d eaten the high GI meal. Interestingly, blood lactate was also higher in the high GI group in the early part of the test (at submaximal intensities), suggesting that athletes engaging in prolonged low intensity exercise might benefit from a low GI pre-exercise meal.
However, it may be that athletes who routinely use carbohydrate drinks during training have little to gain by manipulating the GI of pre-exercise meals. One study looked at trained cyclists who drank a carbohydrate solution during a two-hour submaximal workout followed by a high intensity ride two hours after consuming either a high GI food (potato), a low GI food (pasta) or a low energy jelly (control) (10).
Despite between-groups differences in blood glucose, insulin and fatty acids, the researchers found that the amount and proportion of carbohydrate used for energy was the same, regardless of the pre-exercise meal, with no differences in time taken to complete the high- intensity ride. The researchers concluded that when carbohydrate drinks are ingested in recommended amounts during exercise, the type of pre-exercise carbohydrate consumed has little effect on metabolism or subsequent performance.
Making GI work for you
How can this knowledge about GI and GL help you enhance your own training and nutrition? The following advice should help:- Be sure to include some moderate/high GI carbohydrates in your post-training snacks/meals to maximise glycogen repletion;
- Despite the generally accepted advice, there is little evidence to suggest that higher GI pre-race snacks and meals adversely affect exercise performance during shorter events;
- There is evidence to suggest that low GI carbs may be preferable before longer, lower intensity events (two hours-plus). However…
- If you are susceptible to blood sugar swings (ie you often experience an energy dip 30-60 minutes after eating a carbohydrate-rich meal/snack), stick to low GI carbs for three hours before training, whatever the duration/intensity of your event, as these are less likely to disturb your blood sugar and adversely affect training;
- If weight control is a priority, avoid high GI pre- exercise snacks, which reduce the proportion of energy derived from fat burning during subsequent training;
- Away from training, try to emphasise low GI carbs in your diet, as these are less likely than high GI carbs to over-stimulate your insulin system;
- Remember that the specific effect of a carbohydrate on your blood sugar results from both the quality (GI) and the quantity (GL) of that carbohydrate. Stick to low/medium GL food servings away from training and medium/high GL servings after training;
- The GI and GL of carbohydrates will both be reduced by fat consumed with your meal. For optimum glycogen replenishment, consume your moderate/high GI carbs with only small amounts of fatty foods!
References
- Journal of Applied Physiology 1993; 75:1019-1023
- University of Sydney Glycaemic Index Research Service (SUGiRS) 2005 (www.glycemicindex.com)
- International Journal of Sports Medicine 1991; 12:180-186
- Int J Sport Nutr 1994; 4:361-373
- Med Sci Sport Exerc 1998; 30:844-849
- Med Sci Sport Exerc 1999; 31:164-170
- Med Sci Sports Exerc 1999; 31(3):393-9
- Br J Nutr 2003; 90(6):1049-56
- Int J Sport Nutr Exerc Metab 2000; 10(1):51-61
- J Appl Physiol 1998; 85(6):2220-6
You need to be logged in to continue reading.
Please register for limited access or take a 30-day risk-free trial of Sports Performance Bulletin to experience the full benefits of a subscription. TAKE A RISK-FREE TRIAL
Newsletter Sign Up
Testimonials
Dr. Alexandra Fandetti-Robin, Back & Body Chiropractic
Elspeth Cowell MSCh DpodM SRCh HCPC reg
William Hunter, Nuffield Health
Newsletter Sign Up
Coaches Testimonials
Dr. Alexandra Fandetti-Robin, Back & Body Chiropractic
Elspeth Cowell MSCh DpodM SRCh HCPC reg
William Hunter, Nuffield Health
Keep up with latest sports science research and apply it to maximize performance
Today you have the chance to join a group of athletes, and sports coaches/trainers who all have something special in common...
They use the latest research to improve performance for themselves and their clients - both athletes and sports teams - with help from global specialists in the fields of sports science, sports medicine and sports psychology.
They do this by reading Sports Performance Bulletin, an easy-to-digest but serious-minded journal dedicated to high performance sports. SPB offers a wealth of information and insight into the latest research, in an easily-accessible and understood format, along with a wealth of practical recommendations.
*includes 3 coaching manuals
Get Inspired
All the latest techniques and approaches
Sports Performance Bulletin helps dedicated endurance athletes improve their performance. Sense-checking the latest sports science research, and sourcing evidence and case studies to support findings, Sports Performance Bulletin turns proven insights into easily digestible practical advice. Supporting athletes, coaches and professionals who wish to ensure their guidance and programmes are kept right up to date and based on credible science.
