Nutrition advice for endurance cyclists
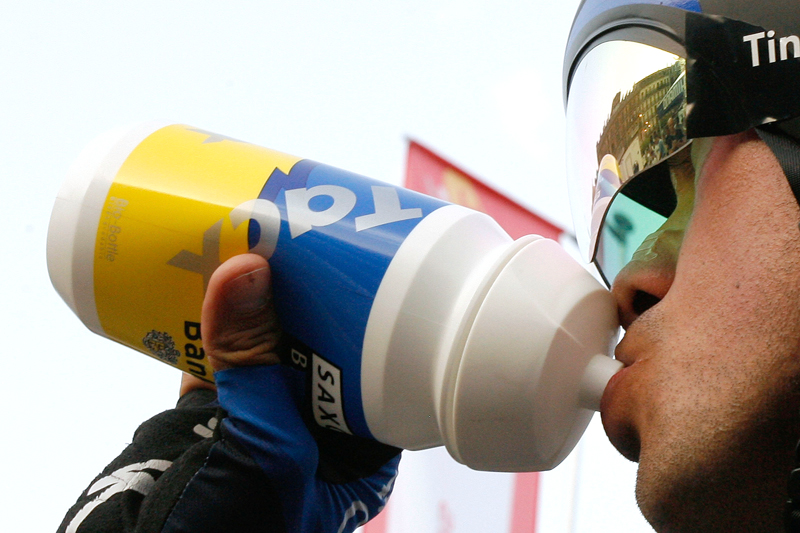
‘Everything about the Tour is just about impossible; you can’t drink enough to keep hydrated, you can’t eat enough carbohydrate to keep fuelled and you can’t eat enough protein to keep your muscle mass. You start lean and finish like a POW!’ This is professional cyclist Magnus Backstedt’s blunt analysis of the unique challenge that is the Tour
de France. Magnus is one of the heaviest riders ever to have finished the Tour and, at over 98kg, his estimated calorie expenditure was regularly over 10,000kcal per day during the mountain stages.
The Tour de France is contested over three weeks and usually involves several consecutive mountain stages. The energy requirements of even the lightest riders are huge and only the fittest, most talented professional cyclists get to start. Many do not even finish.
Every year amateur cyclists can get a taste of what it’s like to take on the Tour, by competing in L’Etape du Tour; literally ‘stage of the tour’, usually one of the mountain stages used in the actual race. This year the Etape route starts in Gap and includes the Col d’Izoard and the Col de Lauteret before finishing on top of the legendary Alpe d’Huez.
A multitude of tools are now available that make it easier than ever to produce accurate ‘real life’ data on the physiological requirements of challenges like the Tour de France. Modern cycle computers can effectively turn a bicycle into a mobile ergometer, and devices such as altimeters are now commonly built into heart rate monitors.
This kind of data is regularly used by teams and professional riders to prepare for races. However, information is seldom published since teams are understandably reluctant to release data that might be used tactically against them. In any case, just how useful data from a tour rider would be to someone preparing for the Etape is questionable. Top professional riders are so much fitter and more skilled than the average Etape rider that they are able to complete a stage in a much shorter time.
In this article we take real data from the 2006 Etape route, ridden at a pace more in line with an Etape rider, and compare this with laboratory data in order to understand the physiological and nutritional mechanisms that can influence performance.
In particular, by comparing this information with indirect calorimetry data, it is possible to work out the fuels used and show the importance of pace judgement on subsequent performance. The importance of carbohydrate feeding provision during the ride and training the ability to use fat as a fuel at high work rates is also revealed, something that applies equally well to many other endurance events.
Let’s start by taking a look at the course and then the actual data we gathered while riding the course:
Calculating power output and energy requirements
The SRM system measures the mechanical work input into the bicycle cranks, but the human body is only about 25% efficient in producing energy on a bicycle. Therefore, the energy used by the human body to produce 5,450kJ is 21,347kJ, or about 5,083kcal (NB 1kcal = 4.2kJ and 1kcal is equivalent to the commonly used food calorie, ie to replace the energy expended in this ride would require the consumption of around 5,000 calories worth of food.). However, to this we need to add around 100kcals per hour to cover basal metabolism (energy used just to keep body processes ticking over) making the energy cost just over 6,000kcal.
Exercise intensity and substrate utilisation
The field-based data we obtained en route provides useful information about the power requirements necessary to complete the Etape route, but has wider significance if we can compare this information with laboratory data.
Relationship between power requirements and nutrition
Many people are familiar with the concept of the ‘fat burning zone’ as illustrated in charts showing percentage energy contribution and typical heart rates that commonly feature on gym walls. Charts showing absolute substrate utilisation are less common since it is harder to make broad generalisations. Success in many endurance events is dependent on a large fat-burning capacity, and often the key to success is not to deviate too far from the fatmax intensity (2).
You can see from the substrate utilisation graph that intensities above fatmax are very costly in terms of carbohydrate usage. The extent of the carbohydrate cost of working at these intensities is often lost in the typical fat-burning zone charts that simply display the relative fuel contribution.
At intensities above fatmax, actual fat usage is less than at lower intensities, so carbohydrate has not only to carry the burden of the increased work rate, but also make up the calorie contribution supplied by fat at the lower work rates. Since carbohydrate has less than half the amount of calories per gram than fat, more than 2g of carbohydrate is lost for every gram of fat that would have been used at lower work rates, and this is obviously very costly in terms of carbohydrate usage.
It is also evident that all significant work intensities require at least some carbohydrate contribution, so when carbohydrate supply is limited, work rates are significantly reduced. This is particularly important in an event such as the Etape because it’s quite possible that the work rate required to keep moving could be higher than that attainable in a carbohydrate depleted state.
The steeper parts of the Col d’Izoard that occur in the last 6km of the 30km climb have altitudes greater than 2,000m, which will also have an adverse effect on exercise capacity. The following example demonstrates how inappropriate pacing could result in carbohydrate depletion before its summit.
- Our rider worked at approximately 190W for the first four hours. He would have used approximately 35g of fat and 100g of carbohydrate per hour.
- Assuming our rider started with a relatively full carbohydrate store (muscle and liver glycogen) of 500g and replaced 60g every hour, he would still have 340g left to tackle the rest of the course.
- Look at the route and you can see that for the first four hours there was significantly more climbing (ascending) than descending, and it was well into hour five before there was any chance to ‘catch up’ on carbohydrate replenishment without actually stopping.
- After the first climb, however, there’s a long descent where it’s possible that the required work rate could be sufficiently low to allow some glycogen replenishment (from carbohydrate feeding).
- But suppose our rider worked at 240W for the first few hours; he would be using 200g of carbohydrate per hour and only 10g of fat. The rider would then run out of carbohydrate before four hours and would be unlikely to make it to the top of the first major climb.
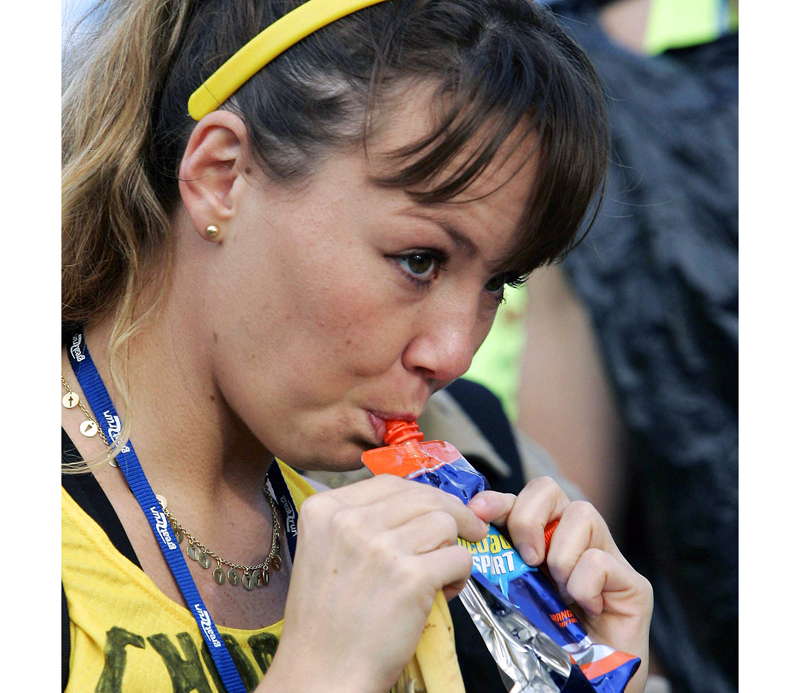
So if carbohydrate is so important, why not just take more than 60g per hour? It seems that the body has a limited capacity to process carbohydrate during exercise and much research into the science of energy drinks has focused on ways to deliver carbohydrate energy more rapidly to the working muscles. The highest carbohydrate oxidation rates reported in the scientific literature (in laboratory conditions) appear to be about 102g per hour when carbohydrate was provided as a mixture of different types of sugars in the same drink (3).
Oxidation rates using less sophisticated carbohydrate mixtures such as glucose or sucrose solutions show little support for supplying carbohydrate at rates greater than 60-80g per hour. There is obviously scope for improving carbohydrate delivery if competitors take advantage of modern energy drinks but this requires more thought than simply taking vast amounts of any carbohydrate. Taking too much carbohydrate, in whatever form, is more likely to compromise hydration and result in gastrointestinal distress than improve performance.
While cases of riders consuming much more than 80g per hour are not unheard of, usually the challenge is to remember to deliver more than 60g per hour, especially during the first few hours where there is also a great temptation to work at levels much higher than fatmax.
Body mass and composition
The substrate utilisation method also provides a useful perspective for looking at body mass and body composition. For cyclists, any reduction in weight (eg lighter bicycle, clothing or carrying less drink up the steeper parts of the course) will result in energy savings.
A reduction in body mass seems attractive since it reduces not only weight, but also the body volume, which will result in a reduction in wind drag (the main impedance to level and downhill cycling). But while there is an argument for reducing any non-specific muscle mass, it is the muscle that provides the power and where the significant carbohydrate is stored.
Body fat on the other hand does not provide any force, adds drag and may hinder thermoregulation. But how much do we need to complete an endurance event like the Etape? An 80kg male with a body fat percentage of 14% (just less than the national average) who rides continually for 194 hours (eight days and nights) at a fatmax of 40g per hour would still finish the ride with 5% body fat and weighing 72.24kg.
So, on a one-day event like the Etape, even if a good fatmax of 40g per hour is attained for eight hours, the cumulative fat usage is only 320g. This explains why elite competitors in the Tour de France are able to limit their body fat percentage to 5% or lower without compromising performance. It can also give an idea of the volume of training needed to achieve a body fat goal.
A basic work model can illustrate the huge energy savings possible with a low body fat percentage (eg Tour rider at 5%) compared with a ‘normal’ person at 14%. The extra work done by our normal person in lifting the extra 7.76kg of body fat over the cumulative vertical climbing distance of 4,100 metres is:
Work (joules) = mass x gravity x vertical distance
In this case, the extra work = 7.76kg x 9.81m/s x 4,100m = 309,720 joules (nearly 300kcals).
Our 5% body fat Tour rider would expend 6% less energy over the route, and while there would be some loss of acceleration on the descents (less gravitational force to overcome wind resistance), the overall benefits would still be much greater because of the reduction in drag caused by the smaller body mass.
If you’d like to explore the effect of different variables on the energy cost of cycling in more detail, take a look at the website www.analyticcycling.com, which uses many of these models in a web interface making it easy for riders to apply personal data to performance variables.
Other ways to reduce cycling energy requirements
At speeds over 16km/h on level roads most of the energy cost of cycling comes from overcoming wind drag. Riding immediately behind another rider can reduce the energy cost of cycling on a flat road at 40km/h by over 25%; riding in the middle of a tightly packed bunch can produce energy savings of up to 40%.
Drafting has been described as a very important skill for a competitive cyclist since it can have a huge impact on energy requirements. Scientists analysing data from Tour de France competitors have remarked not only on the exceptionally high power outputs, but also on how riders are able to use drafting skills to complete stages with surprisingly low average powers. One rider was able to complete a six-hour stage of the Tour with an average power of 98W despite a 40km/h average speed(4).
In our case, the data was from one rider in a group of just three, so there was limited potential for drafting. However, since many thousands of riders take part in the Etape, drafting is one of the most effective ways of reducing the energy cost.
The downside for riders using these skills in the Etape is that fast moving bunches tend to keep moving quickly on the climbs. One of the first things people notice when riding a cycle equipped with a power meter is how even small gradients have a huge impact on power requirements.
Recently, scientists modelling cycling time trial performance have debated the merits of using more power on climbs than on flat and downhill sections(5). The reasoning is that wind drag increases as a cube of the speed, so, for example, much less effort is needed to go from 16 to 17km/h than from 30 to 31km/h. This means that going harder on climbs will theoretically result in faster times than an ‘even power’ strategy because the energy losses through wind drag would be lower.
However, the power increase on climbs that have been proposed are much lower (~5-10%) than those that typically occur in uncontrolled bunches. Riders must be aware that trying to keep up with a bunch that continually pushes them to power outputs above their fatmax will have a huge detrimental impact on their carbohydrate stores.
Pedalling cadence and energy
Failing to change down gears when pedalling cadence falls can also increase the rate of carbohydrate usage. Low pedalling frequencies increase the torque on the muscle and so increase the recruitment of fast-twitch muscle fibres (6).
These fibres prefer to use carbohydrate as a fuel since they lack the enzymes necessary to process high quantities of fat. The SRM trace shows that in our example cadence dropped to less than 50rpm for significant time periods (especially towards the top of the first climb) with a gear of 39x27. Most competitors in the real Etape would do well to have gears at least this low.
Although gradients may not look so great on course profiles, competitors need to take account of the length of the climbs and also the effect of altitude. Aerobic power declines by about 5% when compared to sea level at elevations of as little as 500m. Much of the route is over 1,500m and steep sections occur at elevations of over 2,000m. Competitors should account for power losses of 10% or more when choosing gear ratios and pacing strategies.
References
1. Data from Bradley J, University of Central Lancashire, 2002
2. Int J Sports Med 2005; 26(Suppl 1):S28-S37
3. Med Sci Sports Exerc 2004; Vol 36(9):1551-1558
4. J Sci Med Sport 2000; 3(4):414-433
5. Med Sci Sports Exerc 2004; Vol 36(5):S122
6. Eur J Appl Physiol 1992; 65(4):360-4
You need to be logged in to continue reading.
Please register for limited access or take a 30-day risk-free trial of Sports Performance Bulletin to experience the full benefits of a subscription. TAKE A RISK-FREE TRIAL
Newsletter Sign Up
Testimonials
Dr. Alexandra Fandetti-Robin, Back & Body Chiropractic
Elspeth Cowell MSCh DpodM SRCh HCPC reg
William Hunter, Nuffield Health
Newsletter Sign Up
Coaches Testimonials
Dr. Alexandra Fandetti-Robin, Back & Body Chiropractic
Elspeth Cowell MSCh DpodM SRCh HCPC reg
William Hunter, Nuffield Health
Keep up with latest sports science research and apply it to maximize performance
Today you have the chance to join a group of athletes, and sports coaches/trainers who all have something special in common...
They use the latest research to improve performance for themselves and their clients - both athletes and sports teams - with help from global specialists in the fields of sports science, sports medicine and sports psychology.
They do this by reading Sports Performance Bulletin, an easy-to-digest but serious-minded journal dedicated to high performance sports. SPB offers a wealth of information and insight into the latest research, in an easily-accessible and understood format, along with a wealth of practical recommendations.
*includes 3 coaching manuals
Get Inspired
All the latest techniques and approaches
Sports Performance Bulletin helps dedicated endurance athletes improve their performance. Sense-checking the latest sports science research, and sourcing evidence and case studies to support findings, Sports Performance Bulletin turns proven insights into easily digestible practical advice. Supporting athletes, coaches and professionals who wish to ensure their guidance and programmes are kept right up to date and based on credible science.

