You are viewing 1 of your 1 free articles. For unlimited access take a risk-free trial
Training intensity: the long and short of it
Andrew Hamilton looks at the relationship between the intensity of an endurance training session and the duration needed to provide an optimum training effect.
AT A GLANCE
- *Recaps the concepts of energy systems, training intensity and training zones
- *Introduces the concept of maximal duration and how it can be calculated
- *Shows athletes how to calculate the optimum duration of an endurance session based on percentage of maximal duration
Combining these two areas of knowledge has allowed scientists to make solid recommendations about how hard we should train, and how much training we should undertake in a given period of time. But here’s a question for you: suppose you’re training at 85% of your maximum heart rate (hard), how long should that session be to elicit maximum training benefits for that session? Is twenty minutes ideal? Thirty minutes? What about forty-five minutes?
Surprisingly, the relationship between the intensity of a training session and its optimal duration is very poorly understood, and many athletes constantly walk a tightrope between doing too much and feeling exhausted in the following days or not doing enough, which reduces the benefits of the session. In this article therefore, we’re going to look at recent research shedding some light on the intensity-duration relationship, and what this means for your own training session prescription.
Understanding intensity
Before we explore this relationship, let’s start by discussing training intensity. Knowing your ideal training intensity and targeting that intensity is important because different energy systems are used to generate energy in the muscles at different intensities. Exercise very gently and you’ll be deriving nearly all of your energy from the oxidation of fat. Train flat out and nearly all of your energy is supplied from the breakdown of carbohydrate without oxygen.In race conditions, endurance athletes will be deriving energy from at least three different energy systems, which means that they all need to be trained. The need to train these different energy systems in the body has given rise to the concept of distinct training zones, which is a topic covered previously in Sports Performance Bulletin (see issue 350).
To briefly recap, your muscles are fuelled by four distinct energy systems of which three are trainable. Thanks to Nature’s ingenuity, these energy systems are seamlessly integrated together, which is why it’s not apparent that energy use changes as you work harder and harder. The trainable energy systems are:
- The creatine phosphate (CP) system
- The lactate system
- The aerobic system
For example, if you’re doing 20-30 second bursts of high-intensity cycling, you’re using (and training) both the PC and lactate systems. Likewise, a hard 5-minute effort would use both the lactate and the aerobic systems. It’s also important to realize that these zones aren’t fixed; for example, by training your aerobic system, it can kick in earlier and supplement energy output at higher training intensities.
Hopefully you can see that because your muscles use distinct energy systems at different levels of intensity, your training needs to target these energy systems in a way that reflects the demands of the event you do. And if the kind of event you do places demands on more than one energy system (it nearly always does), you’ll need to target each energy system with specific types of training.
FIGURE 1: SCHEMATIC REPRESENTATION OF CONTRIBUTION OVER TIME OF THE BODY’S ENERGY SYSTEMS

Training intensity zones
In recent years, a system of training intensity zones has become popular with endurance athletes. Known as the ‘polarised’ approach to training intensity, this concept assigns your time spent training into three zones - 1, 2 and 3 - which refer to easy, moderately hard and extremely hard intensities of training respectively (see table 1). These zones exploit different facets of the main energy systems during exercise.What’s fascinating is that studies on elite athletes such as runners, cyclists and triathletes suggest that the best way of achieving your maximum endurance potential is to spend the bulk of your training time in zone 1, ensure you spend at least some time in zone 3 but not to spend too much time in zone 2 (the moderately hard zone)Front Physiol. 2014 Feb 4;5:33. Indeed, this research also suggests that this mainly zone 1 with some zone 3 approach (also called ‘polarised’ training) is superior to other kinds of training approaches such as intense intervals, high-volume training and lactate threshold training (see figure 2).
FIGURE 2: TRAINING MODE, % TIME SPENT IN EACH ZONE AND FITNESS OUTCOMESFront Physiol. 2014 Feb 4;5:33


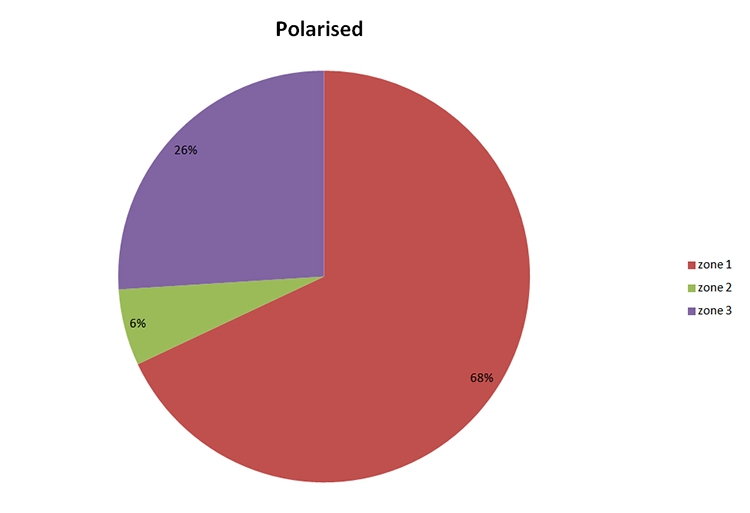
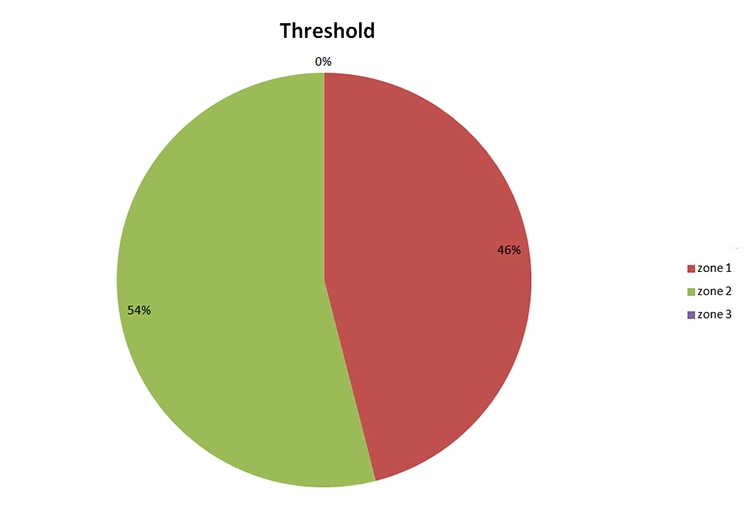
In a 9-week study on 48 endurance athletes including triathletes, cross-country skiers, runners and cyclists, the polarised training regime produced the biggest improvement in aerobic power (up by 11.7%), followed by high-intensity intervals (up by 4.8%). The gains in peak power and times to exhaustion were also greatest in the polarised group (17.8% longer), followed by the high-intensity interval group (8.8% longer). Athletes who trained using threshold or high-volume regimes made no significant gains.
NB: in all graphics, Zone 1 = red, zone 2 = green and zone 3 = purple
TABLE 1 THE THREE TRAINING ZONES
| Zone | Sometimes known as: | Subjective feel: | Typical blood lactate | Typical heart rate | Energy system(s) used |
|---|---|---|---|---|---|
| 1 | ‘Aerobic’, ‘easy’, ‘recovery’, ‘long slow distance’ etc | Easy – you feel like you can keep going and going | Less than 2mmol per litre (mM/L) | Under 80% and typically around 70-75% of maximum | Aerobic system (duration = hours - to the far right of the graph in figure 1) |
| 2 | ‘Threshold training’, ‘intensive endurance’ etc | Moderately hard to hard (you know you’ve had a workout) | Between 2 and 4mmol per litre (mM/L) | Around 80-85% of maximum | Aerobic system with a significant input from the lactate system (duration = minutes – the middle of the graph) |
| 3 | ‘Very high intensity’, ‘race pace’ etc | Very, very hard (you won’t want to stay in this zone for long!) | More than 4mmol per litre (mM/L) | Significantly over 85% of maximum | Lactate system with some input from the CP system - for example during a flat out sprint to the finish line (towards the left of the graph) |
How long?
Understanding concepts such as the polarised training approach can be extremely useful in determining the overall structure of a programme. Using the study above for example, we could extrapolate that with around 10 hours per week training, around seven of those should be spent in zone 1, two and a half hours in zone 3, and just 30 minutes or so in zone 2. But what we can’t deduce is how long these workouts should be. For example, should your seven hours per week training in zone 1 be performed as 2 x 3.5-hour sessions, 3 x 2.3-hour sessions, 4 x 1.75-hour sessions etc, or some kind of combination of the above? The same conundrum exists for the training allocations in zones 2 and 3.Unfortunately, there’s been no clear answer to this; the exercise duration of a session is rarely prescribed by using a precise physiological measure, but is instead mostly set from personal experience. For example, if you’ve ever gone over the top and performed a training session that is both very long and extremely intense, you’ll be familiar with the exhaustion and poor recovery that follows. And when this happens, athletes understand that future sessions at the same intensity need to be shorter!
Because research tells us that the hormonal responses to training will depend on the duration of the sessionAppl. Physiol 2005. 94, 505–513, and that hormonal changes trigger acute and chronic training adaptation, there’s good reason to believe that optimising the duration of a training session is crucial not only to maximise training effects, but also to avoid overload and the risk of illness and injuryBiol. Sports 1996. 13, 169–187.
Using your body’s feedback from previous training sessions is undoubtedly helpful in setting the duration of future sessions to avoid training overload. But what about optimum training session durations to produce a training effect? Again, experimentation can yield useful feedback. Make your sessions too long and the chances are you’ll get run down and injured - too short and you’ll fail to attain new PBs! However, while training intensity can be accurately set in terms of physiological effects, being able to determine an individual’s optimum training duration without the need for trial and error has been a real challenge for exercise scientists. But a new approach recently described by Austrian scientists could provide the first framework to achieve exactly this.
The logarithmic relationship
The solution to a duration prescription relies on the fact that for a certain intensity of exercise, there is a critical time limit for which that intensity can be sustained. This limit is dependent on the type of exercise and the kind of athletes. To illustrate this concept, take a look at figure 3, which shows world record speeds plotted against distance for elite male and female runners (plot A) and freestyle swimmers (plot B).FIGURE 3: RELATIONSHIP BETWEEN DISTANCE COVERED AND THE MAXIMUM SUSTAINABLE SPEED OVER THAT DISTANCEFront Physiol. 2017 May 24;8:337
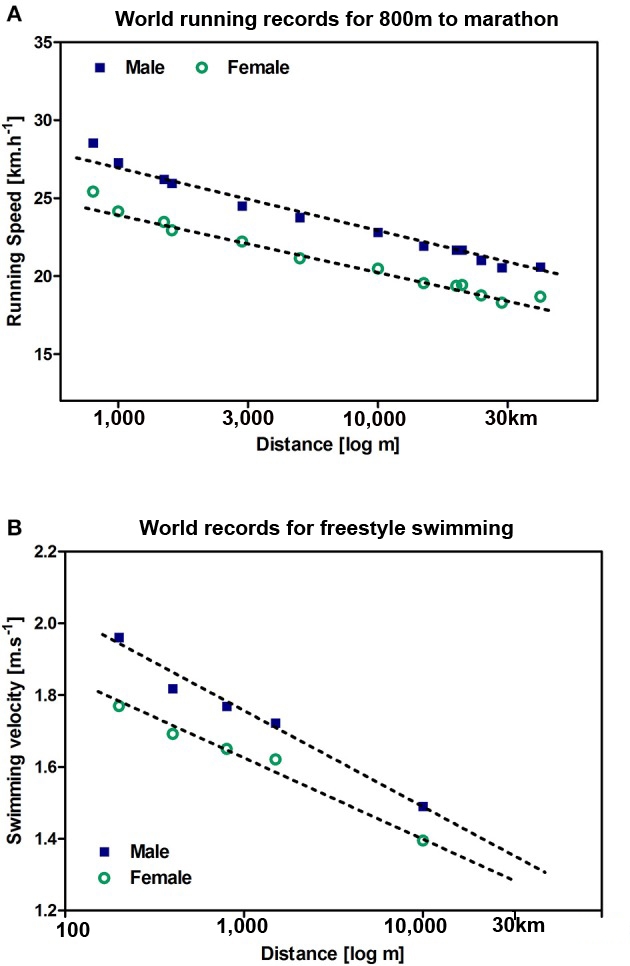
Providing the distance is plotted using a logarithmic scale*, there is an almost perfect inverse linear relationship between maximum sustained speed and distance covered.
*Note: this requires a logarithmic scale along the X axis, where instead of using a normal linear scale of 1,2,3,4 etc, we use 102 (100), 103 (1,000),104 (10,000) etc.
Looking at these plots, we can see that (providing we use a logarithmic scale for the distance), there is an almost perfect linear relationship between the distance of the event and the sustained speed at which that event can be covered. Moreover, this applies across a wide range of distances. This ‘speed-distance’ or ‘power-duration’ relationship can therefore be applied to calculate the maximal speed or power output for any distance or duration. Equally, it can also be used to calculate the maximal duration or distance for an arbitrarily chosen speed or power on an individual basis.
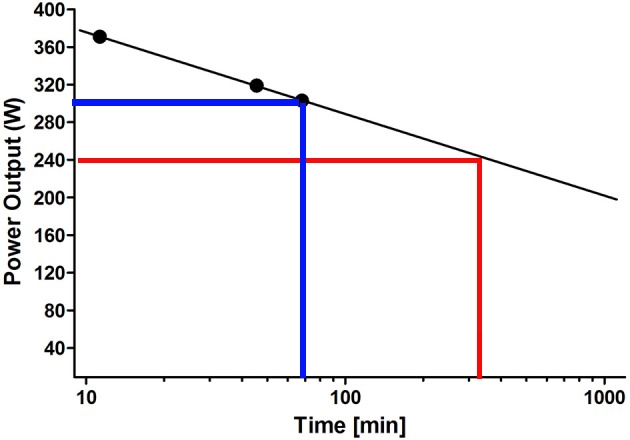
This same concept can be applied to an individual athlete. By plotting your PB speeds or power outputs against distance for more than one distance, you can construct your own speed/power-distance relationship. This can then be used to help you predict the maximum distance you can cover at a sustained speed, or for a given distance, predict the speed you can sustain.
An example of this for an actual cyclist is given in figure 4. The three points show the duration he was able to attain (before his power began to drop) during testing at 370, 320 and 300 watts. At 300 watts (blue line), this was just under 70 minutes. But the plot can also be used as an accurate predictor. Thus, at 240 watts output, he would be able to sustain around 320 minutes before dropping off the pace.
FIGURE 4: CONSTRUCTING AN INDIVIDUAL PLOT
Applying the theory
The plot you create as shown in figure 4 (whether it be for running, swimming, cycling etc) shows you the maximal duration at any given intensity (speed/ power output). That’s a very useful thing to know because you can use this maximal duration figure to help you calculate the approximate duration at a given training speed for a desired training outcome. But to do this, we have to invoke another theory of training adaptation. This theory was advanced by Professor Vladimir Platanov, a world-leading exercise physiologist specialising in endurance trainingPlatonov, V. N. (1999). Workload – Fatigue – Performance: The modern framework of exercise training. (Belastung - Ermüdung - Leistung: Der modern Trainingsaufbau). Münster: Phillippka Sportverlag (German).Platonov’s research led him to conclude that there are four distinct levels of duration (based on percentage of maximum duration), and that training for these different percentages of maximal duration will lead to different training adaptations. As shown in Table 1, level 1 is defined as ‘low workload’, level 2 as moderate, level 3 as sub-maximal, and level 4 as maximal workload. Each of these durations produces different hormonal responses, states of fatigue and, consequently, different effects of adaptation. This approach has since been validated in research by Canadian scientistsEur. J. Appl. Physiol 2005. 94, 505–513.
To illustrate how this works in practice, let’s take a couple of examples using the figures derived from our cyclist in figure 4. Let’s suppose he wants to perform a strictly zone-1 workout to enhance base endurance. We know that for him, a constant 240 watts output is well down into zone 1 – that’s because his power/speed duration testing showed that he can maintain 300 watts for 70 minutes and his plot shows that he should be able to pedal at 240 watts for 320 minutes. However, 320 minutes would be his maximal duration so we can use this figure and the percentages shown in table 1 to calculate what duration he needs to train for to produce a specific session effect:
- For a level-one session at 240 watts, he will need to compete 15-20% of 320 minutes – ie a session of 48-64 minutes.
- For a level-two session at 240 watts, he will need to compete 20-60% of 320 minutes – ie a session of 64-192 minutes.
- For a level-three session at 240 watts, he will need to compete 60-75% of 320 minutes – ie a session of 192-240 minutes.
- For a level-four session at 240 watts, he will need to compete 75-100% of 320 minutes – ie a session of 240-320 minutes.
- Level-one session – 2mins 15secs to 3 minutes
- Level-two session – 3minutes to 9 minutes
- Level-three session – 9 minutes to 11mins 15secs
- Level-four session – 11mins 15secs to 15 minutes
TABLE 1 DEFINITION OF SPECIFIC DURATION DOMAINS FOR ENDURANCE TYPE EXERCISE
| Level | Workload | Duration | Target (main goal of training session) |
|---|---|---|---|
| One | Low | 15–20% of maximal duration | Maintaining exercise performance and accelerated recovery |
| Two | Moderate | 20–60% of maximal duration | Maintaining and slight increase in exercise performance |
| Three | Sub-maximal | 60–75% of maximal duration | Stabilisation and moderate increases in performance |
| Four | Maximal | 75–100% of maximal duration | Distinct and significant increases in performance |
Caveats and cautions
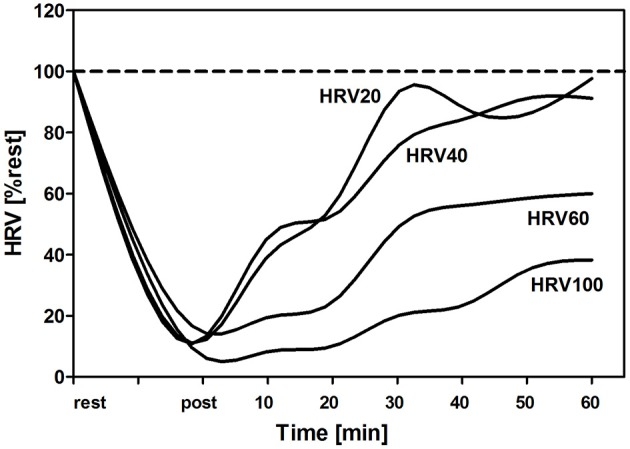
The combination of intensity-duration plots with Platanov’s ‘distinct levels of duration’ gives a useful handle on how long a training session should be to produce a desired and significant outcome. This guidance is particularly useful for low-intensity zone-1 base endurance type sessions where many endurance athletes are unclear as to how long to ride/ run/swim etc for and why. However, it’s very important to understand that there are some big caveats and cautions with this approach (see box 2). Apply it indiscriminately, especially for zone-2 and 3 sessions and it’s likely you’ll end up exhausted! That’s because while the biggest training adaptations occur with level-3 and 4 duration sessions, these are also the hardest to recover from, which means that these sessions need to be used conservatively and in conjunction with other feedback methods such as heart rate variability (HRV) monitoring (see figure 5).The next step
Unlike training intensity, optimising the duration of a training session has been more of an art than a science. However, with the duration-intensity approach, it’s possible for endurance athletes to get a clearer idea of how long a specific session should be in order to produce a specified training effect. To recap, here’s how to do it:- Construct your own duration-intensity curve. Plot the distance covered against your fastest ever (flat-out) time for that distance using a logarithmic scale for the distance (you can print off the blank logarithmic graph paper at the end of this article for this purpose). Repeat this for another distance and draw a straight line through both points. If you have data for other distances, this can be added to create more points. All the points should lie roughly on the same line.
- Use this line as described in figure 4 to predict what your maximum duration is for lower speeds (ie less intense sessions).
- Now use table 1 to determine the optimum duration for lower, training speeds. This will be a level 1-4 percentage of maximal duration, depending on your main goal for that session.
- Don’t forget to apply the commonsense precautions outlined above. This technique is best suited to zone-1 sessions and your responses to training sessions should be monitored – eg how you feel afterwards and with measures of HRV.
FIGURE 5: HEART RATE VARIABILITY (HRV) MEASURES FOLLOWING A ZONE-2 SESSIONFront Physiol. 2017 May 24;8:337.
BOX 1: LIMITATIONS OF DURATIONAL APPROACH
- While being effective at producing training adaptations, higher levels of duration will result in longer recovery periods, and if repeated too often, will lead to fatigue and burnout.
- The durational approach is most effective for low-intensity zone-1 sessions. However, even in these circumstances, very high percentages (towards 60%) of maximal durations can cause sufficient fatigue and impaired recovery to interfere with daily, regular training. For this reason, athletes are advised to start at lower maximal duration percentages when performing level-2 sessions.
- This approach takes no account of your training periodisation, tapering requirements prior to a race etc. You need to factor in these requirements when setting durations.
- Constructing your own duration-intensity plot isn’t always easy. For example, if you’re using PBs set in different races run over different courses, these might not give a completely accurate representation of your performance under standard conditions.
- If you’re a multi-sport athlete (eg triathlete), you’ll need to construct a duration-intensity plot for each discipline.
- The different duration levels (low/regenerative, moderate level without fatigue, level 3 with compensated fatigue and level 4 with clear and substantial fatigue) are not set in stone. In particular, they may vary to some degree depending on the age and sex of an athlete. More research will be needed to add detail, which is why some physiological monitoring makes sense (eg HRV assessment following sessions – see figure 5) to see your response to these duration levels.
Related Files
Newsletter Sign Up
Testimonials
Dr. Alexandra Fandetti-Robin, Back & Body Chiropractic
Elspeth Cowell MSCh DpodM SRCh HCPC reg
William Hunter, Nuffield Health
Newsletter Sign Up
Coaches Testimonials
Dr. Alexandra Fandetti-Robin, Back & Body Chiropractic
Elspeth Cowell MSCh DpodM SRCh HCPC reg
William Hunter, Nuffield Health
Keep up with latest sports science research and apply it to maximize performance
Today you have the chance to join a group of athletes, and sports coaches/trainers who all have something special in common...
They use the latest research to improve performance for themselves and their clients - both athletes and sports teams - with help from global specialists in the fields of sports science, sports medicine and sports psychology.
They do this by reading Sports Performance Bulletin, an easy-to-digest but serious-minded journal dedicated to high performance sports. SPB offers a wealth of information and insight into the latest research, in an easily-accessible and understood format, along with a wealth of practical recommendations.
*includes 3 coaching manuals
Get Inspired
All the latest techniques and approaches
Sports Performance Bulletin helps dedicated endurance athletes improve their performance. Sense-checking the latest sports science research, and sourcing evidence and case studies to support findings, Sports Performance Bulletin turns proven insights into easily digestible practical advice. Supporting athletes, coaches and professionals who wish to ensure their guidance and programmes are kept right up to date and based on credible science.
