Energy deficiency in sport: when the quest for leanness hurts health and performance

Endurance athletes often believe leaner is meaner. But while being lean comes naturally to some athletes, for most club and recreational athletes, the drive to be become leaner and lighter can result in negative consequences. In this two-part series, Alicia Filley explores the impact of energy deficiency on health and performance of male and female athletes.
Understanding relative energy deficiency in sport
To fully understand relative energy deficiency in sports (RED-S) and how it affects athletes, it’s important to first discuss the evolution of this syndrome. Although seemingly recent in its origin, the roots of RED-S lie in the study of menstrual irregularity in female athletes. First noted in the literature in the 1960’s, it wasn’t until their 1981 annual meeting that the American College of Sports Medicine’s (ACSM) formally discussed this topic. By 1992, sports scientists coined the phrase Female Athlete Triad (Triad), to identify a syndrome that presented as disordered eating (DE), menstrual dysfunction, and impaired bone health.However, in 2007, the ACSM tweaked this definition to explore the relationship between not only DE, but overall energy availability (EA), menstruation, and bone status. This adjustment to the definition reflected the fact that both disordered eating (anorexia, bulimia, etc.) and over activity contribute to energy deficit. In other words, reducing input or increasing output brings the same end - ie a shortage of calories. This added clarity allowed sports professionals to classify athletes along a spectrum of health ranging from sufficient EA, normal menses, and solid bones, to low EA, abnormal to non-existent menstrual cycles, and osteopenia or osteoporosis(see figure 1).
Figure 1: The female triad spectrum
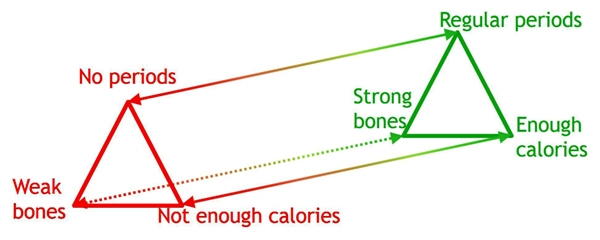
Ideally, athletes should in the green zone, on the right hand side of this spectrum.
Not just women, but men too
Thought for over two decades to be a syndrome solely affecting female athletes, the International Olympic Committee (IOC) issued a controversial consensus statement in March of 2014, expanding this athlete health spectrum to include males and disabled athletes, as well as females(1). Some sport scientists disagreed, and argued that while male athletes may too experience consequences from low EA, these were distinct from that of women(2). However, the IOC insisted that the triad embodied a portion of the spectrum, and integrated it, long represented by a triangle (figure 1), into a ‘hub and spokes’ model of consequences emanating from low EA, or relative energy deficiency in sport (RED-S) (see figure 2). In 2015, the IOC clarified its stance on RED-S to mean ‘where an individual’s dietary energy intake is insufficient to support the energy expenditure required for health, function and daily living, once the costs of exercise and sporting activities are taken into account’(3).Figure 2: The hub and spokes model of health concerns emanating from relative energy deficiency in sport (RED-S)
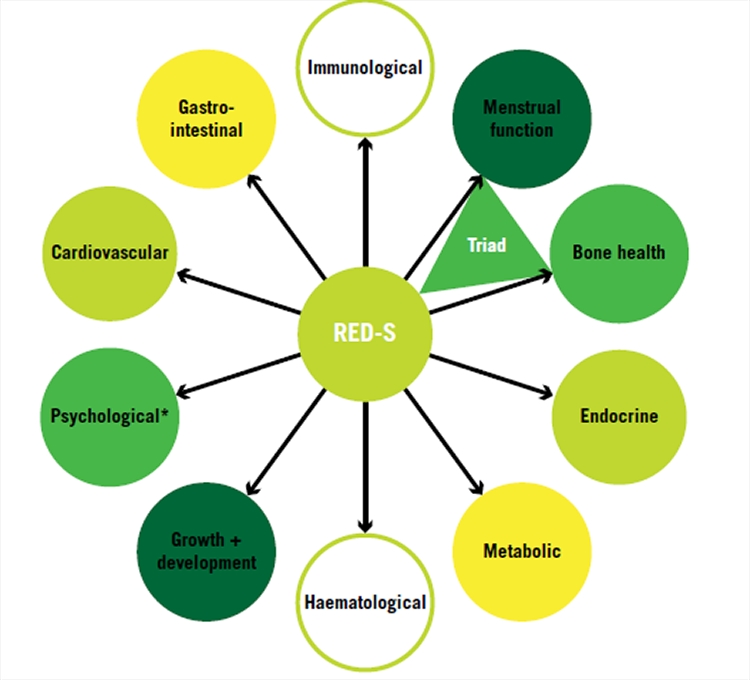
When the body doesn’t have enough energy to support the demands placed upon it, either through disordered eating or over-activity, the consequences go beyond bone health and menstrual function, and affect athletes of both genders, all ages and any ability(1).
Spread too thin
Just prior to writing this article, the IOC has once again updated the consensus statement on RED-S(4). The barrage of research conducted since its initial statement has brought several points to light - most notably, the difficulty in assessing EA. The temptation is to assume that EA is sufficient if one simply feels energetic or not. The actual definition however comes down to a mathematical formula, which subtracts the energy expenditure of exercise (EEE), from the energy intake (EI - the calories the athlete consumes relative to the fat-free mass of the athlete. (see panel 1).In plain English, do you consume enough calories to sustain all bodily systems as well as the physical activity of sport? If not, then your body adjusts to reduce the amount of energy needed to maintain an equilibrium. In most of the population, the body burns excess energy stored as fat; however, athletes who are already quite lean are at risk from the body having to compromise some aspect of physiological function in order to maintain survival.
Panel 1: Calculating your energy availability
Before calculating EA, be aware that the results, based on self reporting, recall, and current phase of training, can be highly unreliable. However, the scores obtained do provide a quick guide to current energy status.Step 1: Calculate available energy for sport by first discovering your fat-free mass (FFM). Multiply your total body weight (TBM), in kilograms, by your percent body fat (BF%) to obtain your fat mass (FM)(6). FM = TBM x BF%
Step 2: Now subtract FM from your TBM to find FFM. The FFM encompasses all of the body’s systems that require energy to stay alive, like organs, brain, and bones. FFM = TBM – FM
Step 3: Now calculate your energy availability (EA) by subtracting exercise energy expenditure (EEE), measured in kilocalories (kcal), from energy intake (EI), also measured in kcal, and dividing that by the FFM. EA = (EI – EEE) ÷ FFM
Example: Consider a competitive male endurance runner who weighs 70kg with 10% body fat, consumes a respectable 3000kcal diet daily, and expends 1000kcal per day in training:
- His FM is 7 kg
- His FFM is 63 kg
- Therefore, his EA is 2000kcals (3000kcal minus 1000kcal), divided by 63 kg.
Energy expenditure: what’s ideal?
Scientists have calculated that an EA of at least 45kcal/kg FFM/day provides enough energy for physiological function and normal sporting activities(5). Athletes in weight restricted sports may tolerate a lesser EA of 30-45 kcal/kg FFM/day for short periods of time by consuming a supervised diet while trying to make weight class(6). However, EA consistently at this level is considered high risk for injury and decreased performance.Energy availability below 30kcal/kg FFM/day puts the body’s physiological systems under stress and becomes detrimental to the athlete’s overall health. Therefore, our sample athlete, while at ‘ideal’ weight and size for an endurance runner, consuming what most think of as a sizeable diet, and still slogging out the miles, is leaching energy from his body and coming dangerously close to compromising his health.
Problems with using EA
While a straightforward equation, one difficulty in determining EA lies in the collection of data to plug into the calculation. The determination of levels of EEE and EI present a challenge. Most studies rely on self-reporting and subjective recall, neither of which is highly reliable. Furthermore, intake and expenditure vary from day to day, and the EA formula provides a snapshot of only one day. The consequences of low EA develop over time, and discrepancies between past EA and the current measurement of EA may exist. Therefore, while the equation is useful as a guide, the IOC refrains from recommending it as a diagnostic tool. Instead, they recommend the RED-S clinical assessment tool (RED-S CAT)(5). The RED-S CAT is a screening tool that categorises risk and sorts athletes into high (red), moderate (yellow) and low (green) risk groupings for sports participation and return to play, based on psychological and physiological measures.Narrow minded
The work of the IOC highlights the fact that contrary to previous thought not only females, but certain categories of male athletes are particularly at risk for RED-S. These include endurance athletes such as runners and cyclists; weight class athletes in combat and martial arts; and jockeys. Much remains unknown about the effect of RED-S on males, but research and awareness are identifying more at-risk men. Researchers think the incidence of low EA in male athletes is lower than females, but lack solid statistical numbers to support this claim.The reasons for low EA in male athletes are similar to females (see figure 3). ‘Making weight’ and the up and down of body composition for combat athletes is likely to contribute to RED-S. Changes in exercise volume without corresponding changes in nutritional support set up endurance athletes for low EA. Poor coaching or guidance from untrustworthy sources (internet chat or gym peers) leads athletes to believe less is more when it comes to food. In some instances, food availability or insecurity is to blame, either due to finances, culture, or geography.
Hungry for more?
The IOC makes very clear that all athletes are susceptible to RED-S. Part two of this series will explore the effect of RED-S on body systems of both males and females, and the treatment approach to return an athlete to health.Figure 3: Low EA and performance
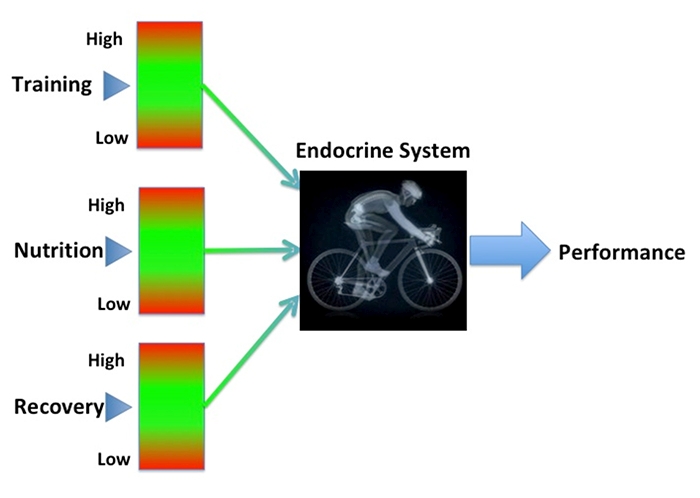
Male or female, low EA results from too much or too little activity, fuel, or rest. Drawing upon the IOC’s classification of RED-S risk as red, yellow or green. Dr Nicky Keay developed a way to illustrate the relationship of the variables that contribute to RED-S and performance (graphic used with permission)(7).
CASE STUDY: Samuel Woodfield
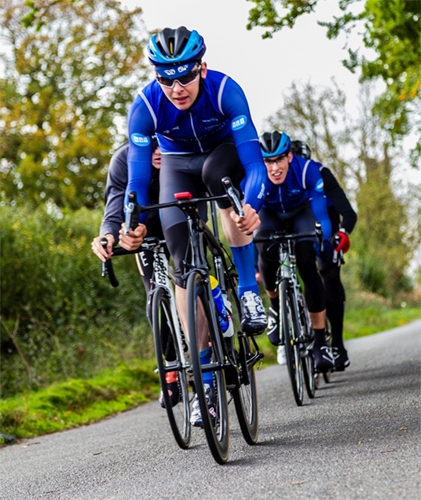
How does an athlete find himself in a situation of relative energy deficiency? Its beginnings can be subtle and shrouded in doing the ‘right’ things to improve performance. Take 27-year-old Cat-1 cyclist and founding member of the Active Edge Road Race Team, Samuel Woodfield. A former National-level swimmer, Sam returned to endurance sport in 2015 and entered his first cycling race one year later as a Cat-4 rider. He experienced a meteoric rise in performance, finishing 2017 as a Cat-1.
Sam’s success was not without cost. Following the philosophy of his coach to maximise the watts per kilogram formula, Sam was encouraged to be lighter and leaner so there would be less mass to propel on the bike. He achieved the weight loss through obsessive ‘clean’ eating, appetite suppression, fasting rides, and even laxative use.
Like many athletes, he initially experienced success with this approach. This formula, however, works only to a point. Without guidance as to where the plateau is, athletes like Sam, continue to chase lower numbers on the scale in the hopes of decreasing time at the finish. His performance started to suffer in the autumn of 2016. Sam notes that there were signs of his body’s demise long before his performance faltered. “I didn’t really sleep. Hormonally, I could tell things were wrong. I was very anxious, moody, very, very regimented, and anti-social.”
Thanks to the advice of a trusted friend, Sam enlisted the help of Renee McGregor, a performance and eating disorder dietician, who helped him rectify his nutritional deficits. He then added coach Ali Slater and sports physician Dr Nicky Keay to his team of experts for care and guidance. Rather than prescribe total rest, they allowed supervised high volume activity (12-16 hours per week) but nothing over 70% maximal heart rate. Unfortunately for Sam, the damage had already been done and he was diagnosed with osteoporosis in his lumbar spine.
Sam found his health and coaching dream team and now the numbers he focuses on are performance indicators. With an increase in lean body mass of only 1.5 kg, Sam’s 20-minute performance went from 4.6 watts/kg to 5.1 watts/kg. “My 20-minute power has increased by 13% purely by just riding at low intensity and allowing the body to become functional and healthy again.” In addition, Sam’s bone health continues to improve toward osteopenia in his spine and normal bone elsewhere.
Coach Slater points to reduced training intensity and increased rest as crucial to Sam’s recovery. “We focused on improving the dietary issues before moving back into proper structured training,” he says of their approach. Current power numbers are not only better, but repeatable. Progress in Sam’s heart rate response, sleep, mood, and improvement rate allow him to now increase the intensity of training.
It takes courage for athletes long in the energy hole to admit to secretive and disordered behaviors such as laxative use, purging, chemical appetite suppression, starvation, and over exertion; and a significant amount of support to change their mindset from restriction to fueling. Sam attests that with the reward of better health and performance, the changes are well worth it.
References
- Br J Sports Med. 2014;48:491-97
- Br J Sports Med. 2014;48:1461-65
- Br J Sports Med. 2015;49(7):417-21
- Br J Sports Med. 2018;52:687-97
- Br J Sports Med. 2015;0;1-3
- Sports Med. 2017 Oct;48(Suppl 1):1-24
- bit.ly/2GLkztk
You need to be logged in to continue reading.
Please register for limited access or take a 30-day risk-free trial of Sports Performance Bulletin to experience the full benefits of a subscription. TAKE A RISK-FREE TRIAL
Newsletter Sign Up
Testimonials
Dr. Alexandra Fandetti-Robin, Back & Body Chiropractic
Elspeth Cowell MSCh DpodM SRCh HCPC reg
William Hunter, Nuffield Health
Newsletter Sign Up
Coaches Testimonials
Dr. Alexandra Fandetti-Robin, Back & Body Chiropractic
Elspeth Cowell MSCh DpodM SRCh HCPC reg
William Hunter, Nuffield Health
Keep up with latest sports science research and apply it to maximize performance
Today you have the chance to join a group of athletes, and sports coaches/trainers who all have something special in common...
They use the latest research to improve performance for themselves and their clients - both athletes and sports teams - with help from global specialists in the fields of sports science, sports medicine and sports psychology.
They do this by reading Sports Performance Bulletin, an easy-to-digest but serious-minded journal dedicated to high performance sports. SPB offers a wealth of information and insight into the latest research, in an easily-accessible and understood format, along with a wealth of practical recommendations.
*includes 3 coaching manuals
Get Inspired
All the latest techniques and approaches
Sports Performance Bulletin helps dedicated endurance athletes improve their performance. Sense-checking the latest sports science research, and sourcing evidence and case studies to support findings, Sports Performance Bulletin turns proven insights into easily digestible practical advice. Supporting athletes, coaches and professionals who wish to ensure their guidance and programmes are kept right up to date and based on credible science.

